Disclaimer: The results presented here are preliminary. The project is currently ongoing, and additional findings will be shared as they become available.
WP2 – Characterizing industrial high temperature processes and current feedstock/nonenergy use (demand side)
A “High Temperature Technology Factsheet template” was developed. It provides a structured framework for developing comprehensive and stand-alone fact sheets on high temperature low-carbon technologies. Each sheet is designed to be concise, clear, and self-sufficient, typically spanning six to nine pages, with the main messages clearly highlighted. The template draws inspiration from existing fact sheet formats developed by the U.S. EPA, the European Parliament, the European Commission’s JRC, and the Danish Energy Agency. Overall, the template serves as a comprehensive tool to assess low-carbon industrial technologies, combining technical, economic, environmental, regulatory, and sectoral perspectives while systematically presenting both barriers and enablers to their large-scale deployment.
The previously developed template will be used to assess 10 high temperature technologies. The technologies included were selected based on three criteria:
- High Technology Readiness Level (TRL > 7)
- Ability to deliver high-temperature heat (> 400 °C)
- Relevance and applicability to the Belgian industry
- Not assessed by other research organizations.
Here is the list of the 10 high temperature technologies that will be studied with factsheets : Plasma Torches, Electric Arc Furnaces, Induction Heating, Electric Heated Rotary Kilns, Oxyfuel Combustion, Electric Resistance Radiant Tubes, Microwave Heating, Hydrogen Burners, Immersed Electrodes and Rotodynamic Heating.
The first factsheet is about Plasma Torches and has been intentionally developed as a pilot version to be reviewed and refined in collaboration with FPS and other key stakeholders before expanding to the full set of factsheets. This iterative approach ensures that the structure, content detail, and data presentation are validated and aligned from the outset.We selected the plasma torch technology as the starting point because it represents a strategically relevant, emerging electrification pathway with increasing industrial interest and ongoing demonstration projects across sectors such as steel, cement, and waste processing. Its high potential for deep decarbonization and cross-sector applicability made it a suitable first case for testing the factsheet concept.
Disclaimer: The template and the factsheet on plasma torches are not yet final. They need to be challenged and discussed with industrial stakeholders.
WP3 – Typology of possible low-carbon technologies to meet the industrial high temperature process requirements or to produce feedstock molecules (supply side)
Definition of Key Performance Indicators KPI
For possible low-carbon technologies to meet industrial high temperature process requirements, a certain number of options exists. With, kilns and furnaces, burning natural gas or burning syngas containing a certain percentage of hydrogen or burning pure hydrogen (or even ammonia) but also electric furnaces and kilns (using low CO2 electricity of course).
In order to get a comparison between different decarbonized options for these high temperature heating devices, i.e. kilns and furnaces, it is important to define KPI’s:
- Safety
- Temperature profile in furnace
- Flexibility (in terms of grid implications) of the low-carbon technology (including the local storage and buffering needs and consequences)
- Sustainability of the energy source solution (various emissions, GHG savings, …)
- Adequacy (security of supply) of the energy source
- Potential advantages and expectations of the new technology
- TRL level of the technology
- Costs (CAPEX, OPEX)
- Logistic aspects
- Lead time (year of availability)
- Local restrictions and more specifically in the context of Belgium (with e.g. the available electricity and gas grid capacity)
- Process limitations
- Life time
Focus on hydrogen combustion
Some initial results have been obtained on the flow and heat CFD computations of a real large glass furnace currently in operation, for which ULB-ATM has had access to all experimental data (geometry, dimensions, flow rates, temperatures, pressures, flow velocities, refractory brick characteristics, internal protection solutions, etc.). The results so far have been fully satisfactory when burning natural gas (real case) as well as syngas (a mixture of natural gas and H₂, up to 20% so far). These results were obtained using a downscaling of the real furnace by a factor of 1:21 (the existing furnace is 53 m long, which would otherwise result in an extremely large number of computational cells and excessively long CFD computation times).
Figure 1 shows the influence of the CFD mesh refinement on the temperature distribution in a cross section of the furnace. The objective is to reach a correct distribution (2.350 °C is the experimental value of the furnace temperature in the simulated working conditions) without too many mesh cells in order to avoid a too high computation time. The results show that with slightly fewer than two million mesh cells (black curve in Figure 22), the temperature distribution has converged satisfactorily. This level of mesh refinement will be used in the next stages of the modelling.
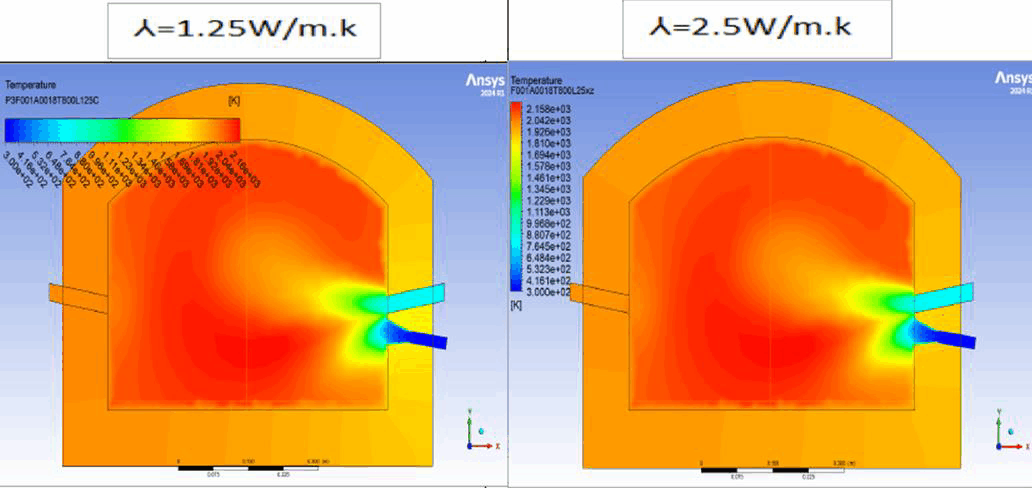
The objective of this part of the study is to investigate the influence of the thermal conductivity of refractory bricks on the temperature distribution within a real glass melting furnace. Four thermal conductivity values were tested 0.06 W/m·K, 0.2 W/m·K, 1.25 W/m·K, and 2.5 W/m·K. Figure 2 shows that a low thermal conductivity (e.g., λ = 0.06 W/m·K) significantly reduces heat losses through the walls, thereby increasing the furnace’s energy efficiency. And more conductive materiel (e.g., λ = 2.5 W/m·K) leads to increased thermal losses. The graph shows that the temperature remains stable around 2150 K.
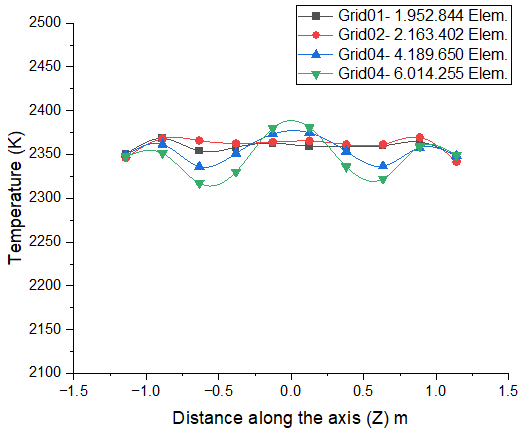
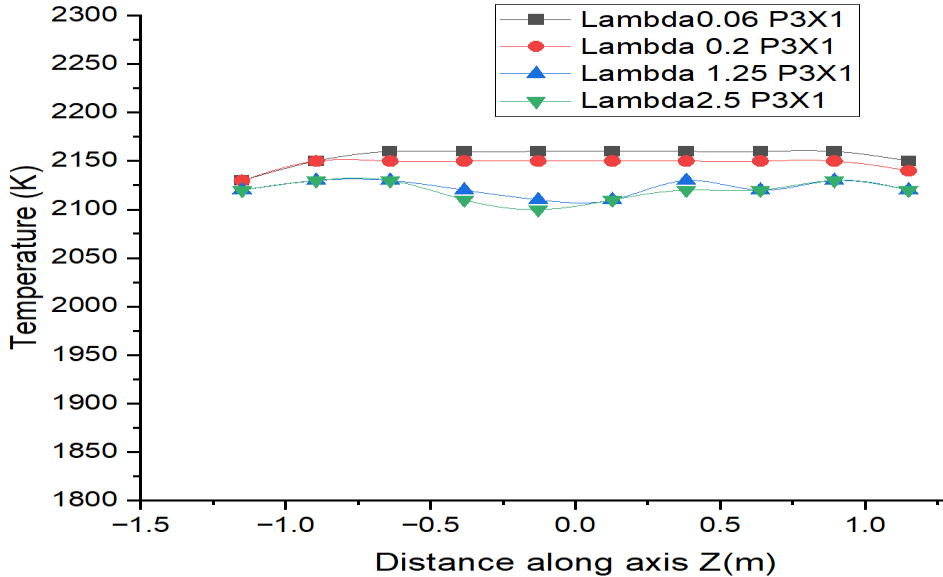
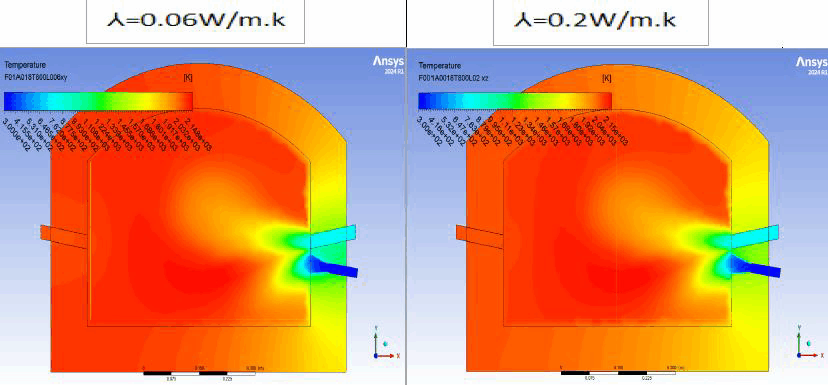
Figure 3 shows a detailed temperature distribution in a cross section of the furnace for varying thermal conductivity Lambda.
The numerical simulation will progress to include
- syngas (CH4 + H2 with various mixing ratios) combustion instead of pure CH4
- pure H2 combustion
- O2 as an oxidizer instead of just air.
Focus on oxy-combustion and oxy-recirculation – Complementary modelling on oxy-recirculation
Although the CO₂ recirculation loop is included in the TIMES modelling processes and has therefore already been studied within this project, a complementary modelling exercise was undertaken to further investigate this complex loop. The TIMES model, developed under WP4, enables a highly detailed representation of the Belgian energy system. It covers all sectors and the various options available for achieving national carbon neutrality by 2050. While TIMES offers greater precision compared to other models used for analysing Belgium’s energy transition, interpreting results for a specific process can sometimes be challenging. Interactions across sectors (industry, residential, transport,…) mean that developments in one sector inevitably influence others, and vice versa. This interconnectedness is inherent to the TIMES approach and forms one of its main strengths. Furthermore, since the CO₂ recirculation loop has received little attention in the literature, it appeared relevant to investigate it further in more detail.
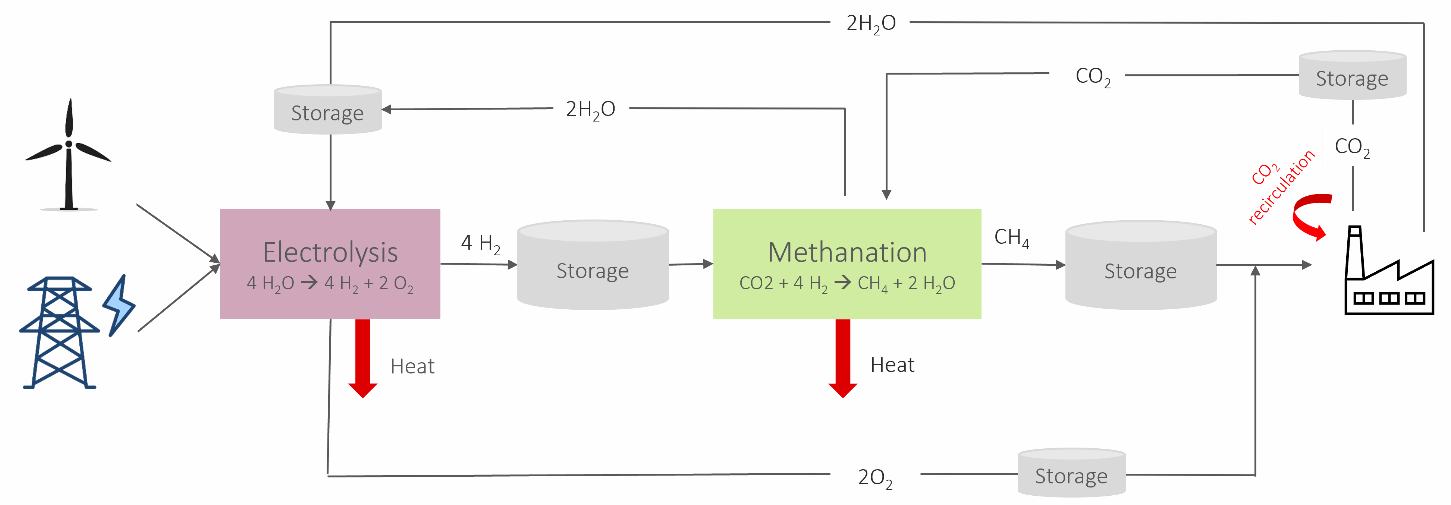
This complementary modelling exercise was carried out using the Python programming language. This model focuses specifically on the loop presented above and is designed at the scale of an industrial plant. The modelling of this oxy-recirculation loop aims to:
- Estimate the total costs of such a system,
- Dimension the main components (electrolyser capacity, methanation reactor, and storage units),
- Assess to what extent this system could also contribute to the flexibility of the electricity grid through the storage of excess electricity production in e-H2 or e-CH4
- Improve the understanding of uncertainties surrounding this type of process.
In simplified terms, the concept can be viewed as a solution “plugged” in front of an existing industrial kiln without requiring replacement. This loop therefore enables the indirect electrification of high-temperature heat while retaining current kilns and their design by burning e-methane.
Here are the main assumptions for the first test case:
- Industrial facility with an annual natural gas consumption of 100 GWh.
- The starting year is set to 2040, which is considered realistic in terms of technological maturity while ensuring deployment does not occur too late, i.e., too close to 2050.
- The calculation horizon is 30 years, with reinvestments included for components with shorter lifetimes.
For the first test case, the industry is assumed to connect directly to a wind farm through a Power Purchase Agreement (PPA). Electricity availability therefore fluctuates according to wind generation, while the electricity price remains constant. A second case has also been simulated, representing a connection to the conventional electricity grid, where electricity prices fluctuate but availability is unconstrained. The results of this second case are not presented yet, as explained below, these are not the final results as the modelling phase is not finished yet.
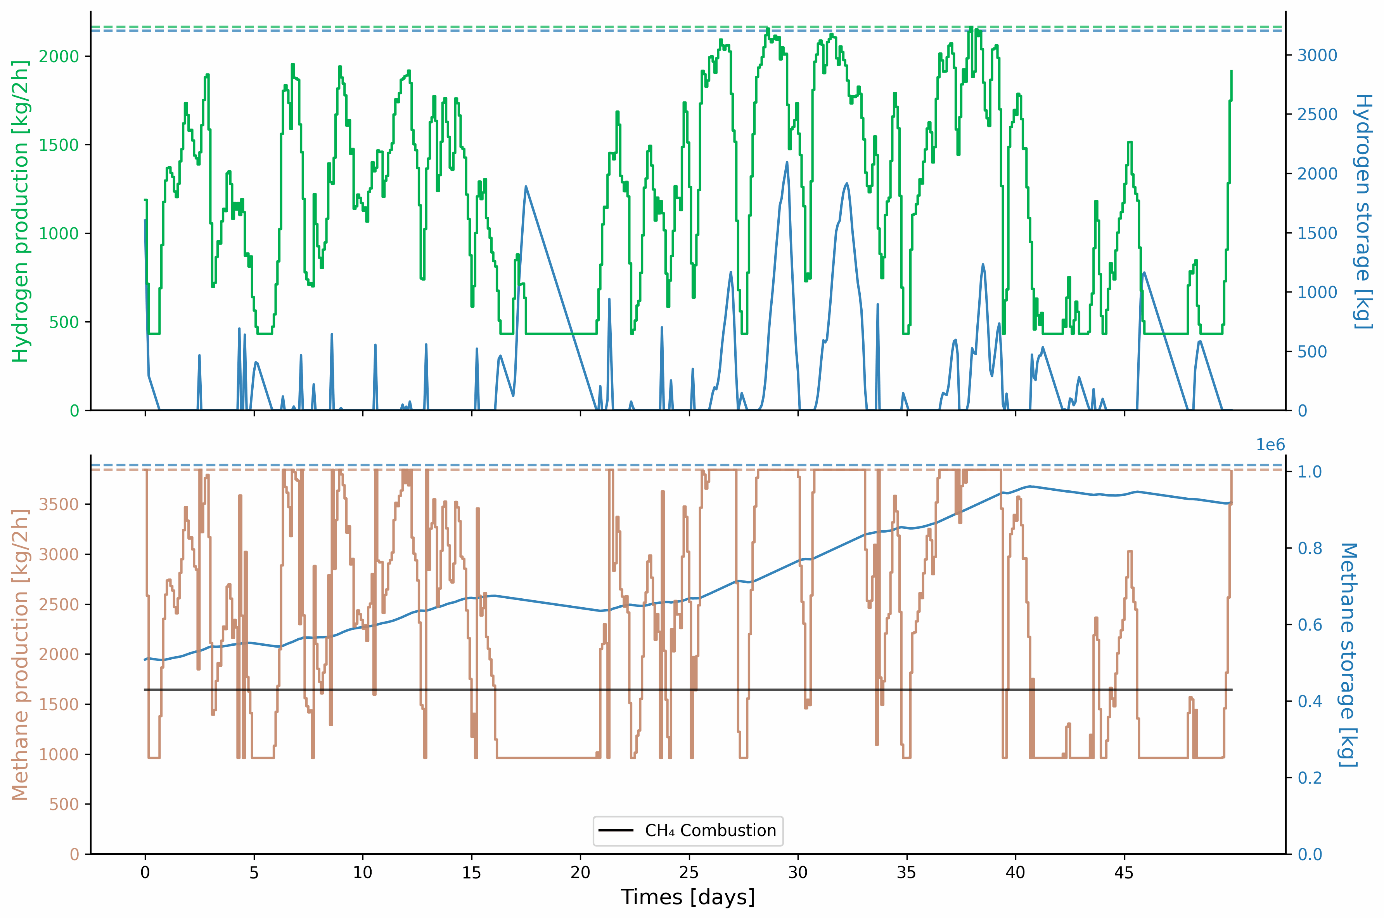
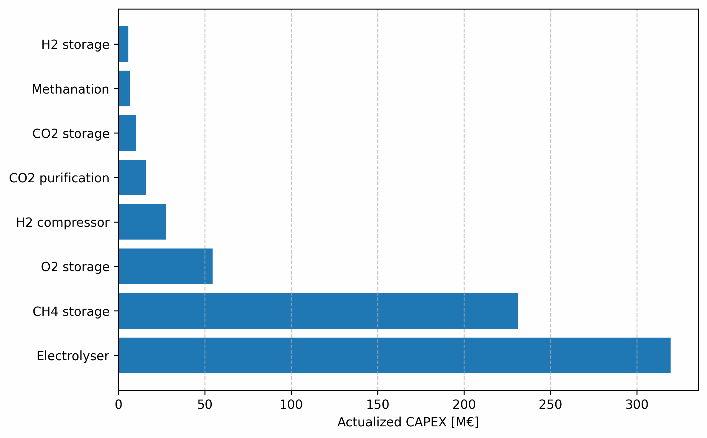
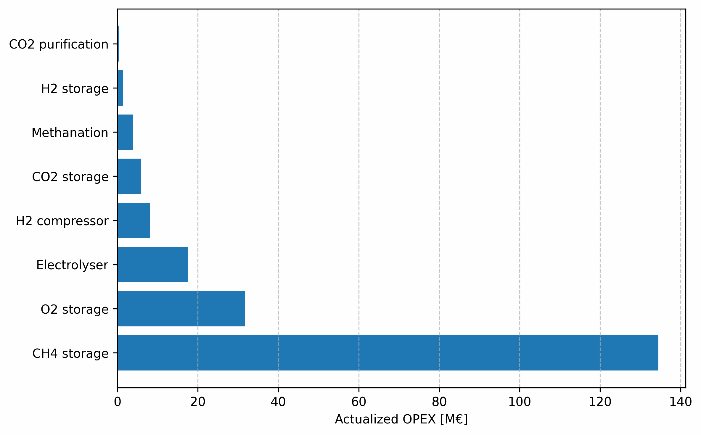
Figure 5 shows the evolution of production from both the electrolyser and the methanation reactor, along with the corresponding levels of hydrogen and CH₄ storage. The dashed lines above the graphs represent the installed production and storage capacities. It is to be noted that the scales of H2 storage and CH4 storage are different. The maximum value of the y-axis of the first graph (hydrogen storage) is 3000 kg while the maximum value of the y-axis of the second graph (methane storage) is 1000 000 kg of CH4. A first conclusion seems to be emerging. The model ‘prefers’ storing CH4 rather than H2. This conclusion will need to be confirmed by further simulations once all cost data has been found or validated. Figure 6 and 7 present the discounted CAPEX and OPEX, respectively, for each “block” included in this modelling exercise.
A detailed analysis is not provided yet, as the results remain subject to change for reasons outlined earlier. The purpose here is to illustrate the type of outputs that this modelling approach is able to generate.
Disclaimer: The results presented should be regarded as provisional. The modelling work is not yet complete: some data still requires validation, electricity consumption for several components must be added (except for the electrolyser, already included), part of the validation has been carried out but further checks remain, and both the model constraints and test cases must still be refined.
WP 4 – Modelling high temperature industrial processes and feedstock use in TIMES
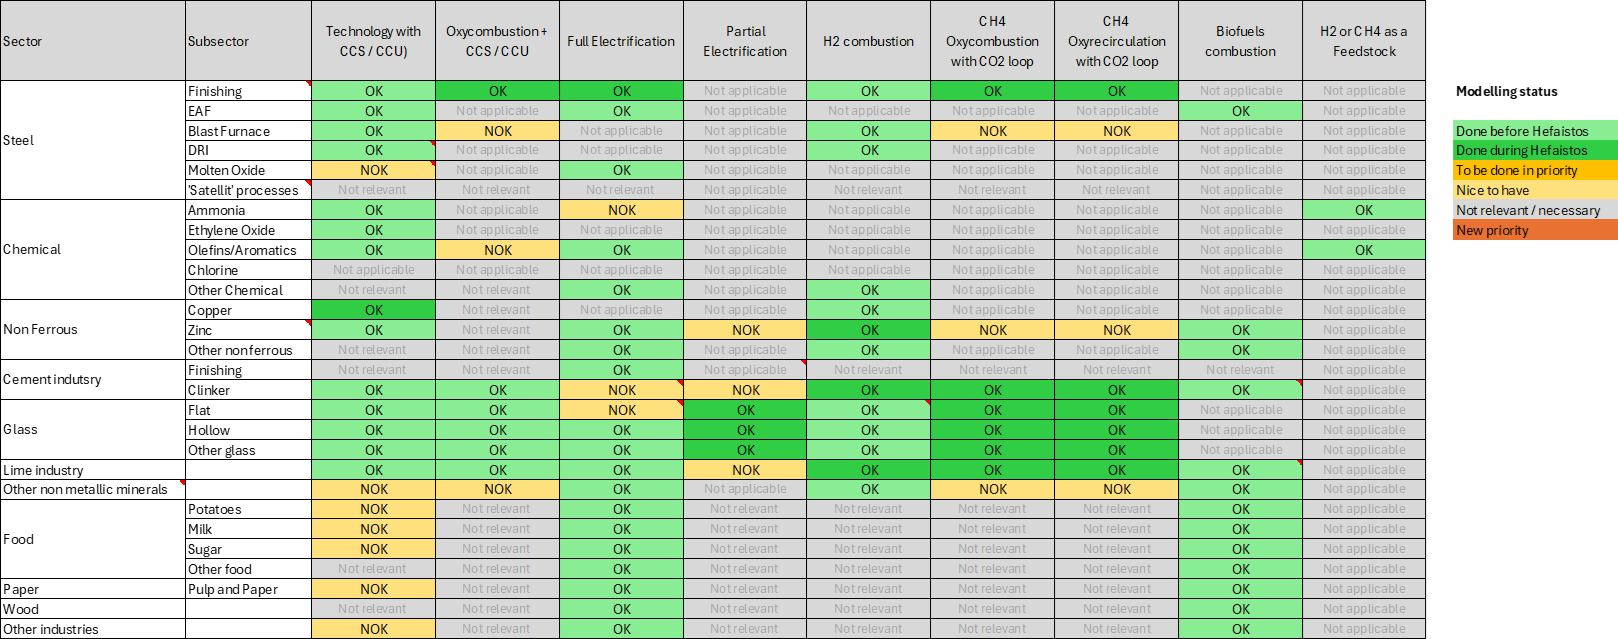
The adaptation of the TIMES model has been completed. To achieve this, the modelling of new technological options for decarbonizing high-temperature heat in each of the previously identified sectors was finalized. Figure 8 below illustrates the different options that have been added for each sector within the Hefaistos project.